

Complete Analysis of the Economic Survey 2025-26
The Economic Survey 2025-26, presented on January 29, 2026, offers a mostly positive outlook on India’s economy. It will help shape the Union Budget 2026. The report highlights India’s strong growth momentum. The First Advance Estimates forecast real GDP growth for FY2025-26 at 7.4% with GVA at 7.3%. This makes India the fastest-growing major economy for the fourth consecutive year. This high growth is backed by strong private consumption, which grew around 7.0% in FY26, ongoing public capital spending, and stable inflation. In fact, average CPI inflation was just 1.7% for April to December 2025, the lowest since the CPI series began. This drop is mainly due to falling food and fuel prices. These economic trends set the stage for the policy decisions in Budget 2026.
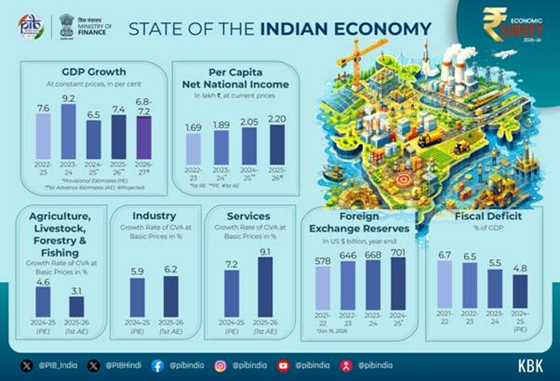
The Survey’s macroeconomic overview (see infographic above) confirms India’s strong performance. While global growth is still uncertain, India’s output continues to surpass its peers. Private consumption has surged, with PFCE at around 61.5% of GDP, thanks to low inflation and rising real incomes. Investment is also on the rise; gross fixed capital formation grew about 7.8% in FY26, remaining at roughly 30% of GDP. On the supply side, services continue to drive growth. Services GVA expanded about 9% in H1 FY26, with a projected growth of around 9.1% for the entire fiscal year. Meanwhile, manufacturing and industry are improving (see below). Inflation has remained low, averaging 1.7% from April to December 2025. This gives the RBI room for policy changes, even while noting global price pressures. Looking ahead, growth for FY2026-27 is expected to be between 6.8% and 7.2%.
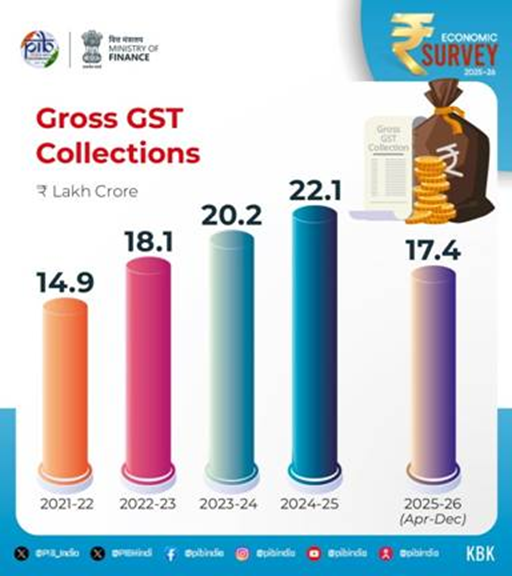
The fiscal and monetary stance remains cautious. The Centre’s revenue receipts increased to about 9.2% of GDP in FY25, driven by strong non-corporate taxes. Gross GST collections reached ₹22.1 lakh crore in FY25, with ₹17.4 lakh crore collected between April and December 2025, which is an increase of about 6.7% year on year.
Strong revenue trends and controlled subsidies have enabled debt reduction. The general government debt-to-GDP ratio has dropped by approximately 7.1 percentage points since 2020. The Survey highlights three credit-rating upgrades in 2025, showing fiscal credibility. Meanwhile, public capital expenditure has surged. Effective capital spending now stands at about 4.0% of GDP for FY25, up from 2.7% pre-pandemic, indicating a push for infrastructure. However, states’ finances are under stress. Combined state deficits increased to around 3.2% of GDP in FY25, compared to approximately 2.8% pre-pandemic, highlighting fiscal pressures at the state level. Overall, prudent fiscal management is praised, but the Survey warns that further consolidation is necessary to meet medium-term targets and maintain stability.
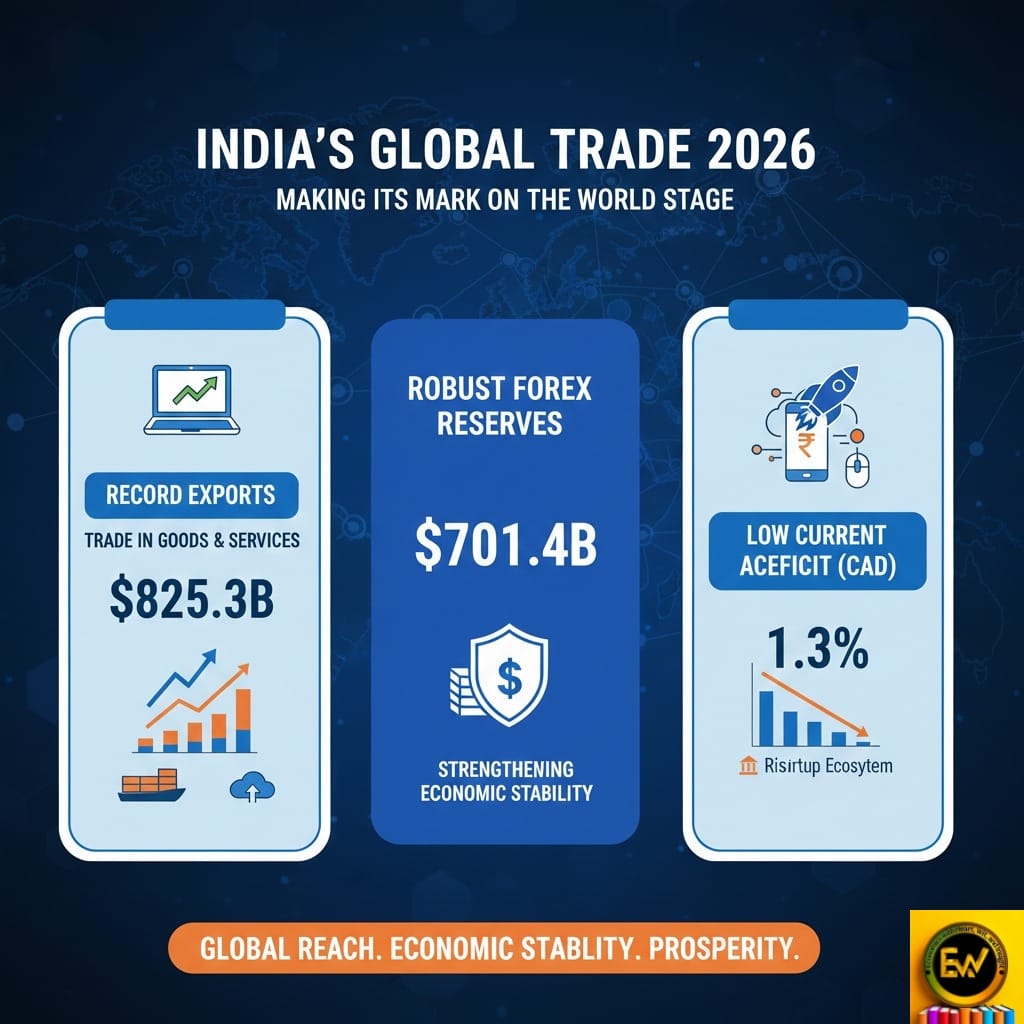
India’s external sector remains strong and resilient. Total exports reached a record $825.3 billion in FY25, growing 6.1%, mainly driven by services exports of $387.6 billion. India’s share in global goods exports has nearly doubled from 1.0% in 2005 to 1.8% in 2024. Despite a merchandise trade deficit, strong services exports and remittances of $135.4 billion helped keep the current account deficit low at 1.3% of GDP in Q2 FY26. Foreign exchange reserves rose to $701.4 billion in January 2026, covering about 11 months of imports. Strong FDI inflows of $64.7 billion and diversified trade partnerships further enhance India’s ability to manage global economic shocks.
Sector-Wise Performance Analysis
Agriculture
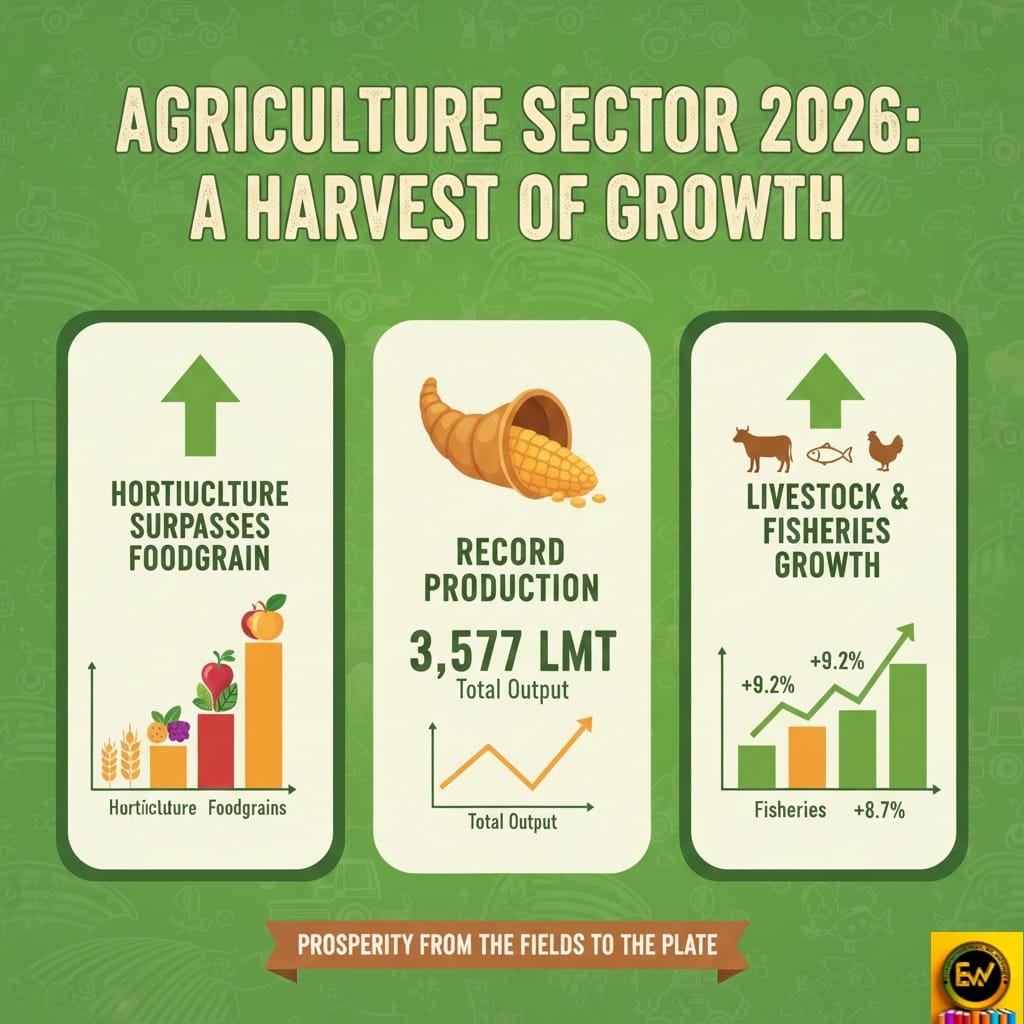
India’s agriculture sector is steadily moving up the value chain, growing at an average of 4.4% each year from FY2016 to FY2025. Growth is now driven more by related activities than by cereals. Livestock GVA rose nearly 195% from FY2015 to FY2024. Fisheries output increased by 140% from 2014 to 2024. Horticulture production reached 362 million tonnes in FY25, surpassing food grains. India leads in onion production and ranks second in fruits and vegetables.
| Agricultural Indicator | FY24 (PE) | FY25 (Estimate) | Growth/Impact |
| Sectoral GVA Growth (%) | 3.1% | 3.8% | Rebound to trend |
| Foodgrain Production | 332.3 MT | 357.7 MT | Increase of 25.4 MT |
| Horticulture Production | – | 362.1 MT | Higher than foodgrains |
| PM-KISAN Beneficiaries | 11 Crore | 11 Crore | ₹4.09 Lakh Cr disbursed |
Food grain output hit a record 3,577 lakh metric tons in AY2024-25, strengthening food security. The Survey supports reforms like better market infrastructure, MSP, and income transfers, with ₹4.09 lakh crore released under PM-KISAN. However, climate change remains a major challenge. It requires climate-smart farming and more value addition.
Industry & Manufacturing
India’s industrial sector picked up speed in FY26. The Survey states that the industry GVA grew by about 7.0% in the first half of FY26 despite challenges from the global economy. Manufacturing output rose significantly: +7.72% in Q1 and +9.13% in Q2 FY26, on a GVA basis, showing a strong recovery. Key policy drivers are clear. Production-Linked Incentive (PLI) schemes in 14 sectors have attracted around ₹2.0 lakh crore in new investment and are estimated to have created additional production worth ~₹18.7 lakh crore and 12.6 lakh jobs by September 2025. Important initiatives like the National Manufacturing Mission and PM GatiShakti aim to further support manufacturing.
| Industry Insight | Metric / Data Point | Historical Context |
| Industry GVA (H1 FY26) | 7.0% Growth | Up from 5.9% in FY25 |
| Core Sector Growth | 2.9% (Index) | Discrepancy with GVA noted |
| Steel/Cement Ranking | 2nd Largest Globally | Sustained core momentum |
| Coal Production (FY25) | 1,047.5 MT | Historic high (4.98% growth) |
| Pharma Turnover (FY25) | ₹4.72 Lakh Cr | 3rd largest by volume |
The Economic Survey stresses the need to move up the value chain, shifting from labour-intensive production to high-tech manufacturing, as part of the “Make in India” vision. It notably points out the India Semiconductor Mission, where 10 semiconductor projects worth around ₹1.6 lakh crore have been approved, indicating progress in critical high-tech areas. At the same time, there are ongoing efforts to scale MSMEs through credit linkages and infrastructure corridors, along with improvements in the ease of doing business. The Survey also notes India’s gains in innovation. For instance, India rose to 38th in the Global Innovation Index in 2025, up from 66th in 2019, pointing to a growing startup and R&D ecosystem that can boost manufacturing growth.
Services Sector
The services sector is the main driver of India’s growth, contributing about 53.6% of GDP in H1 FY26 and 56.4% of total GVA, the highest ever recorded. India is the 7th-largest exporter of services, with its global share increasing from 2% in 2005 to 4.3% in 2024. Services also lead FDI inflows, making up about 80% of total inflows during FY23 to FY25.
High-growth areas include IT/BPM, financial services, telecom, tourism, fintech, e-commerce, and online education and health. Digital and technology-based services are becoming essential to economic growth. The rise of gig and platform work, such as ridesharing and freelancing, shows changing employment patterns. Overall, the growth in services highlights India’s strengths in skills, technology, and global digital integration.
Employment, Human Capital & Social Sector
The Survey shows clear progress in jobs, skills, and welfare. Female labour force participation increased sharply from 23.3% in 2017 to 41.7% in 2023. Meanwhile, unemployment dropped from 5.6% to 3.2%. In the first half of FY26, approximately 56.2 crore people were employed, and about 8.7 lakh new jobs were added in Q2. Rural employment relies on agriculture and self-employment, particularly among women. In contrast, urban jobs are mostly in services and regular wage positions. The informal sector is still important, employing 12.9 crore people.
| 6.7% of the workforce by 2030 | FY26 Data / Metric | Policy Target / Goal |
| Gig Workforce Size | 1.2 Crore (FY25) | 6.7% of workforce by 2030 |
| e-Shram Registrations | 31 Crore | Universal social security |
| Skill Loan Limit | Increased to ₹7.5 Lakh | Facilitate high-end skilling |
| Internship Target | 1 Crore Youth (5 yrs) | Top 500 companies bridge |
| Unemployment Rate | 4.7% – 5.6% (Seasonal) | Labour & Skill Indicator |
Labour reforms, including the new Labour Codes, now provide social security to gig and platform workers. Gig employment grew by 55% from FY21 to FY25. The e-SHRAM portal has registered 31 crore unorganised workers, while the National Career Service portal has created millions of job opportunities. Skill programs like PM Kaushal Vikas Yojana aim to prepare a workforce for the future.
In the social sector, school enrollment rates are high, and higher education institutions are expanding. Health indicators, such as maternal and child mortality, have improved significantly. The Survey emphasises that ongoing reforms in education, healthcare, and skill development are vital to fully benefit from India’s demographic dividend.
Financial Sector & Investment Climate
India’s financial sector is becoming more stable and inclusive. Scheduled commercial banks have strong asset quality. The gross NPA ratio was just 2.2% in September 2025, with net NPAs around 0.5%. Credit growth accelerated to 14.5% year-on-year in December 2025, fueled by strong demand in the industry and retail segments.
Financial inclusion has expanded significantly. There are over 55 crore Jan Dhan accounts, including 36.6 crore in rural areas, and about 23 crore e-Shram IDs for unorganised workers. The mutual fund investor base now includes 5.9 crore unique investors, many from smaller cities. GIFT City’s IFSC is attracting global capital. According to the 2025 IMF-World Bank FSAP review, total financial assets account for about 187% of GDP. Well-capitalised banks and NBFCs indicate strong resilience to economic shocks.
| Banking/Financial Metric | March 2015/18 | Sept/Dec 2025 |
| GNPA Ratio (SCBs) | 11.18% (2018) | 2.2% |
| Net NPA Ratio (SCBs) | 5.94% (2018) | 0.5% |
| PCR (SCBs) | 49.31% (2015) | 93.2% |
| CRAR (SCBs) | 12.94% (2015) | 17.24% |
| SCB Net Profit (FY25) | – | ₹4.01 Lakh Cr |
The investment climate is also improving. FDI inflows remain strong, at approximately $64.7 billion from April to November 2025. This growth is supported by liberalisation and PLI. India ranked 4th globally in greenfield investments in 2024, showing confidence in the market. Capital market participation has broadened, with demat accounts exceeding 21.6 crore by December 2025 and an increase in retail investors. Gross fixed capital formation (GFCF) is rising again, with about 7.8% growth in FY26, supported by government spending. The Survey emphasizes the need to encourage private investment. It highlights rising corporate capex plans and the easing of business regulations as positive trends. Investment in infrastructure—such as roads, rail, ports, and digital networks—is seen as a key driver of growth. Overall, while private capex is still bouncing back from the pandemic, policy measures like PLI, tax incentives, and land reforms are gradually improving the investment climate.
Digital Economy & Innovation
The Survey showcases India’s rapid digital transformation driven by robust Digital Public Infrastructure (DPI). Platforms like UPI, Aadhaar, FASTag, and DigiYatra have made payments, identity access, and service delivery better. With tele-density surpassing 86% and 5G coverage reaching nearly all districts, digital connectivity now aids financial inclusion, e-governance, tele-health, and online education. DPI has helped millions enter the formal economy.
The Survey also highlights the need for innovation and AI policy. It suggests an application-based AI strategy aimed at addressing real issues in fields like healthcare, agriculture, and education through small, locally deployable systems. It encourages open and interoperable AI platforms to ensure broader access. Skill readiness is supported through initiatives like the ‘Earn & Learn’ model, which prepares youth for jobs influenced by AI.
India’s innovation ecosystem is getting stronger, with an improved Global Innovation Index ranking (38th in 2025), a rise in startups and unicorns, increased R&D investment, and new innovation funds. Overall, technology is viewed as a major driver of inclusive growth and job creation.
External Sector & Global Positioning
India’s trade and global presence have grown. In FY25, merchandise exports reached about $448 billion, and services totalled approximately $387.6 billion, adding up to around $825.3 billion. Exports have become more varied; engineering goods, pharmaceuticals, IT services, and green energy products have increased, even amidst fluctuating oil prices and changing geopolitical conditions. The Survey highlights India’s achievements in trade diversification, ranking it highly on a global scale. Between CY2005 and 2024, India doubled its share of world exports. Consequently, India has a bigger role in global supply chains, especially in electronics, chemicals, and agriculture.
| Trade Metric (FY25) | Value | Trend / Context |
| Total Exports | $825.3 Billion | Record High |
| Services Exports | $387.6 Billion | 13.6% Growth |
| Forex Reserves | $701.4 Billion | 11 months import cover |
| Remittances | $135.4 Billion | World’s largest recipient |
| Merchandise Share | 1.8% | Doubled since 2005 |
Financially, India ranks as one of the top destinations for foreign direct investment (FDI). In 2024, it was the third-largest for greenfield projects worldwide, with over 1,000 projects in manufacturing, and the fourth-largest overall among medium- and low-income economies. The Survey stresses that maintaining openness and improving intellectual property protections, along with simplifying business regulations, will attract more investment in telecom, defence, and high-tech industries. Geopolitically, India’s standing is increasing, with leadership roles in forums like G20, BRICS, and QUAD. However, the Survey warns that India must manage trade tensions and changing alliances carefully. Overall, the external outlook is positive: trade remains strong, capital inflows are steady, and the currency and reserve buffers are reliable, instilling confidence in India’s position in the global economy.
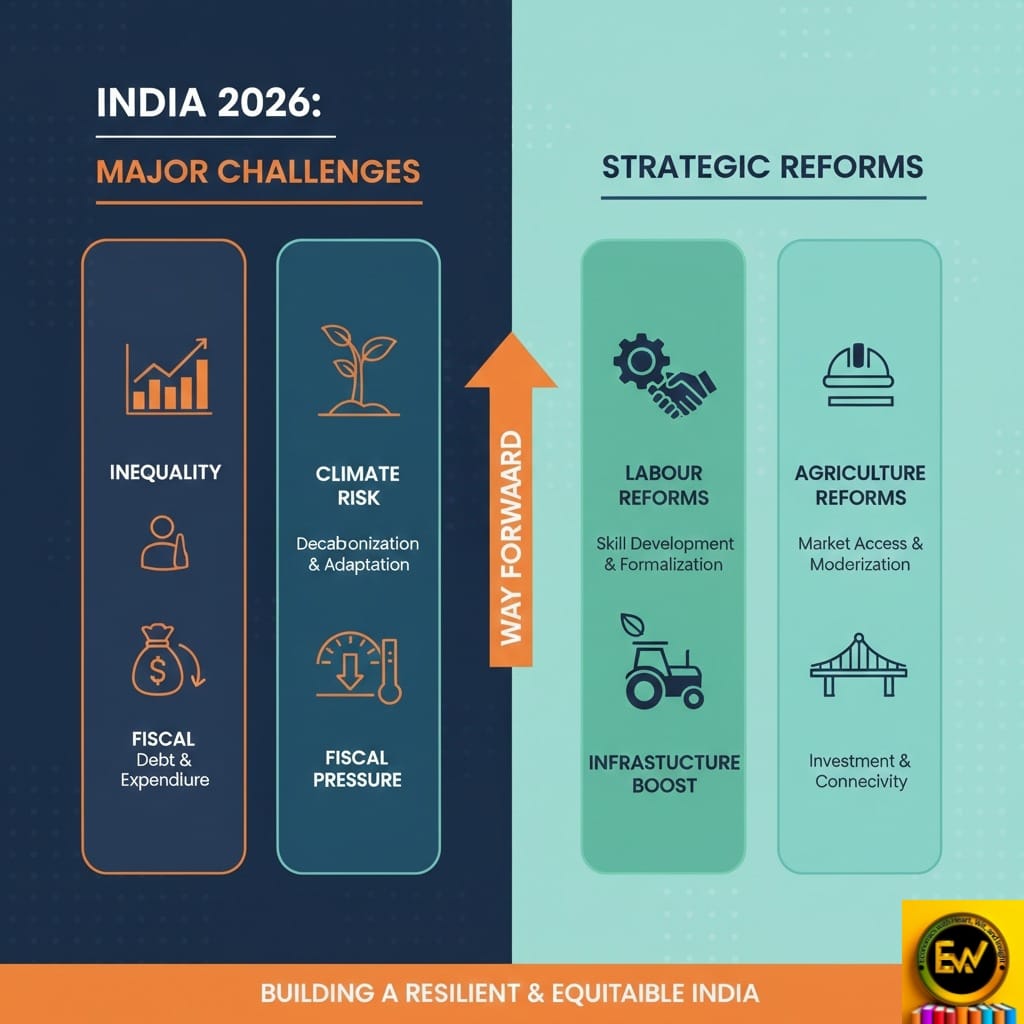
Key Challenges Highlighted in Economic Survey 2026
Despite the positive outlook, the Survey clearly points out several challenges:
Opportunities & Policy Recommendations
Income Inequality and Social Inclusion: India’s rapid growth has not benefited everyone equally. Although poverty (NITI Aayog’s MPI) has dropped dramatically (from 55.3% in 2005 to 11.28% in 2022)[50], income and opportunity gaps remain significant. Wealth concentration and the divide between rural and urban areas are also concerns. The Survey warns that continued progress will require tackling inequality through targeted social policies and equal access to education, healthcare, and finance.
Unemployment and Job Quality
The Survey acknowledges recent job gains but emphasises the importance of work quality. Creating formal sector jobs, skilling the workforce, and increasing female labour participation are still priorities. It points out that labour reforms (like those for gig workers) should go hand in hand with flexible work hours and skills training (for instance, evidence from India’s Time Use Survey on women’s double burden)[37][51]. In summary, the Survey sees pockets of unemployment (especially among youth and women) and underemployment (the working poor) as ongoing challenges.
Climate Change and Environmental Risks
A whole chapter focuses on climate and environmental issues, marking them as economic challenges. While India’s per-capita carbon footprint is low, the Survey highlights that climate shocks (such as heatwaves, floods, and cyclones) pose risks to agriculture and infrastructure[26]. Water scarcity and air pollution are also significant problems. The Survey emphasises “Adaptation Matters” by calling for climate-resilient farming, disaster preparedness, and a shift toward green energy. Managing climate risks is seen as critical for sustaining growth.
Fiscal Pressures
Although fiscal management has improved, the Survey cautions about tightening budget space. The Centre’s fiscal deficit is around 6.4% of GDP in FY24, and states’ deficits are now about 3.2% of GDP in FY25[12], resulting in high interest liabilities. The Survey notes that subsidies and debt servicing may limit future spending. It stresses the need for reliable consolidation (as outlined in the FRBM roadmap) once the economy achieves higher growth.
| Fiscal Metric | Pre-Pandemic (Avg) | FY25 (PA) | FY26 (BE) |
| Central Fiscal Deficit (%) | 3.5% – 4.5% | 4.8% | 4.4% |
| Revenue Receipts (% GDP) | 8.5% | 9.2% | 9.1% |
| Effective Capex (% GDP) | 2.7% | 4.0% | 3.1% |
| Gross GST (Monthly Avg) | ₹0.9 – 1.0 Lakh Cr | ₹1.8 Lakh Cr | ₹1.9 Lakh Cr |
Global Headwinds
Finally, the Survey highlights external uncertainties as a risk. Geopolitical tensions (such as trade wars and fragmentation), global monetary tightening, and commodity price swings could affect India. For example, the Survey points out that US and EU tariffs may impact Indian exporters in certain sectors. It advises caution, suggesting that India should build resilience (through reserves and diversified trade) and avoid complacency due to temporary boosts.
The Economic Survey 2025-26 outlines opportunities and reforms for sustained growth:
“Disciplined Swadeshi” for Strategic Resilience:
A central theme is India’s need to be self-reliant in critical technologies and manufacturing. The Survey proposes a three-part swadeshi strategy: build core capabilities (like semiconductors, defence tech, pharmaceuticals), reduce dependence on unstable inputs (through better logistics and alternative sources), and gradually shift from self-reliance to being crucial in global chains. This means supporting manufacturing (PLI schemes, technology missions) and controlling essential supply chains (like rare minerals and electronics).
Continued Structural Reforms:
The Survey recommends deepening key reforms. In labour markets, it notes the positive impact of labour codes and suggests completing their implementation (such as universal social security registration). In agriculture, it highlights the need for market reforms (farmer-producer organisations, private participation in storage and marketing) to connect farmers to markets. Financial sector reforms (insolvency resolution, bond market development) are encouraged to improve credit supply. Overall, the message is to keep reducing regulatory hurdles (land, power) and lessen “legislative obstacles” to business, to support the recovery in investment and productivity.
Investing in Human Capital and Innovation:
The Survey highlights the importance of skilling and education for growth. It praises initiatives like the recently announced National Credit Framework and enhanced vocational programs (such as PM SVANidhi for street entrepreneurs and skill diplomas in schools). It also calls for workplace training schemes (like an ‘Earn & Learn’ model) to connect youth skills with industry needs. On healthcare, it suggests ongoing expansion of insurance (Ayushman Bharat) and nutrition programs. Importantly, the Survey points out that boosting R&D and innovation is crucial: India’s innovation rank has improved, but public R&D investment remains low (around 0.7% of GDP). It suggests increasing R&D funding and fostering startup ecosystems (for example, easing IPO funding and adopting startup-friendly data policies) to drive long-term productivity.
Green Growth and Sustainability:
The Survey sees climate action as an opportunity. Renewable energy capacity has grown nearly sixfold since 2014, and renewables now represent about 50% of India’s power capacity. India is the world’s third-largest solar and overall renewables market. The Survey calls for increasing green infrastructure (wind and solar farms, hydro projects) and efficiency (smart grids, EV charging networks). It also encourages investments in climate resilience (water recycling, crop insurance, urban flood management), noting that sustainable practices can create new industries. Carbon markets (PM’s “GoI Green Credit” initiative) are mentioned as a way to motivate businesses.
Digital Expansion and Public Goods:
Finally, the Survey recommends building on India’s digital progress. This includes expanding broadband and 5G to underserved areas, digitising more public services (land records, e-governance), and promoting fintech innovation (open banking, digital lending to MSMEs). As noted, digital infrastructure has created inclusive opportunities, and the Survey suggests intensifying these efforts to boost entrepreneurship in small towns and villages (for instance, through digital agro-markets or telemedicine).
These measures, if implemented, form a long-term roadmap. They fit with the survey’s vision of “Viksit Bharat 2047,” which envisions an economy that is high-growth, self-reliant in strategic areas, digitally advanced, and socially inclusive.
| Growth Indicator | FY25 (PE) | FY26 (FAE) | FY27 (Projected) |
| Real GDP Growth (%) | 6.5% | 7.4% | 6.8% – 7.2% |
| Real GVA Growth (%) | 6.2% | 7.3% | 6.7% – 7.1% |
| Potential Growth Rate (%) | 6.5% | 7.0% | 7.0% – 7.5% |
| Nominal GDP Growth (%) | 9.0% – 9.5% | 8.0% | 9.5% – 10.0% |
Conclusion
The Economic Survey 2025-26 offers a cautiously optimistic view of India’s economy. It points out strong fundamentals, such as growth above 7%, record exports, low inflation, and rising incomes per person. However, it emphasises that maintaining this progress requires addressing social and economic inequalities, managing external risks, and continuing structural reforms.
The Survey highlights resilience, digital growth, public infrastructure, and developing human capital as key areas for future growth. It suggests that upcoming policies and budgets will focus on capital investment, technology-driven development, and inclusive progress. While the short-term outlook remains strong, ongoing reforms in labour, agriculture, and infrastructure are crucial for ensuring long-term, sustainable growth. Overall, the message is one of careful optimism; India is moving forward steadily but must stay proactive in facing new challenges.
Key Takeaways
- High Growth, Low Inflation: GDP is expected to grow around 7.4% in FY26, with inflation at about 1.7% from April to December 2025.
- Strong Demand: Private consumption is increasing. Public capital expenditure is about 4% of GDP. Services make up 53.6% of GDP.
- Agriculture Improvement: Related sectors are boosting incomes. Horticulture, at 36.2 crore tonnes, surpasses foodgrains. The foodgrain output reached a record 3,577 LMT for AY24-25.
- Services & Industry Growth: Services exports stand at $387.6 billion for FY25. Manufacturing GVA increased by 7 to 9% in the first half of FY26. PLI and semiconductor initiatives are growing the industry.
- Financial Stability: Gross NPAs are low, at 2.2%. Credit growth is strong. FDI is about $64.7 billion. UPI is driving fintech growth.
- Social Progress: Female labour participation is at 41.7%. Unemployment stands at 3.2%. Welfare schemes are extending their coverage. Education and health indicators are improving.
- Digital Push: UPI, Aadhaar, FASTag, and widespread 4G/5G, with a tele-density of 86.8%, are strengthening inclusion and e-governance.
- Key Challenges: There are issues with income inequality, climate risks, and rising state deficits, which are at 3.2% of GDP. Reforms in labour, land, logistics, and sustainability are needed.
- Challenges Remain: Issues like income inequality, climate vulnerability, and rising state deficits—projected at 3.2% of GDP—are concerning. There is a need to focus on job quality and environmental sustainability. The Survey recommends a “disciplined Swadeshi” strategy and calls for ongoing reforms in labour, land, and logistics to address these challenges.

